Observability is evolving — no longer is it enough to just have logs, or just metrics, or just traces. In the era of Observability 2.0, we’re looking at comprehensive approaches that unify and standardize these data streams, providing a central point of truth. This is where OpenTelemetry (OTel) comes in, offering a vendor-agnostic standard to instrument, generate, collect, and export telemetry data. By adopting OTel, you’re future-proofing your observability strategy, decoupling your applications from specific vendors, and creating flexible, portable pipelines of telemetry data.
In this post, we’ll talk about what OpenTelemetry is, why it’s a game-changer, and how you can set up a sleek observability pipeline using the AWS OpenTelemetry Collector. We’ll dive into how you can receive data in an OTel-compliant way, process it, and export it to multiple backends, all while staying cool, calm, and cloud-native.

Observability 2.0: Beyond Just Logs, Metrics, and Traces
The old world of observability had disparate tools, each specialized in its own dimension — some were great at logs, others at metrics, and still others at traces. This fragmentation made it hard to see the full picture of what’s going on in your distributed environment. Observability 2.0 aims to break down these silos. It’s about:
- Standardization: Define a single language that tools can speak, so logs, metrics, and traces aren’t handled in isolation.
- Flexibility: Pick and choose the best-of-breed observability services (Datadog, Prometheus, AWS X-Ray, CloudWatch, etc.) without rewriting instrumentation.
- Portability: Move your workloads and their telemetry anywhere (on-prem, different clouds, hybrid). Your pipeline doesn’t lock you into a single vendor or solution.
Introducing OpenTelemetry
OpenTelemetry (OTel) is an open-source project born out of the merger of two popular projects — OpenCensus and OpenTracing. It provides a set of language-specific SDKs and APIs for generating telemetry data and a vendor-neutral specification for how that data should look.
Benefits of OpenTelemetry:
- Vendor-Agnostic: You’re not stuck with a single backend or proprietary instrumentation.
- Single Standard: Logs, metrics, and traces all follow a coherent structure, making cross-tool correlation easier.
- Rich Ecosystem: A huge community and support from major cloud and observability vendors.
- Future-Proof: As observability evolves, OTel evolves with it, so you’re ready for whatever comes next.
Potential Downsides:
- Learning Curve: Migrating from custom or legacy instrumentation to OTel might require extra effort.
- Overhead in Setup: While powerful, OTel’s abstraction may require some initial configuration and adaptation in your environment.
But the benefits typically far outweigh these drawbacks — especially if you value flexibility and future-proofing.
The AWS OpenTelemetry Collector: Your Unified Data Funnel
Once you’re generating data in OTel-compliant formats, you need a powerful, flexible pipeline to move it from source (receivers) to destination (exporters). That’s where the AWS OpenTelemetry Collector comes in. It’s a distribution of the OTel Collector that integrates seamlessly with AWS services, allowing you to receive, process, and export telemetry data — no matter where it’s coming from or going to.
What is the AWS OpenTelemetry Collector?
It’s a vendor-supported build of the OTel Collector, pre-configured and optimized to work with AWS offerings. It lets you:
- Receive: Telemetry from OTel-compliant clients, Prometheus endpoints, StatsD agents, Zipkin, Jaeger, AWS X-Ray, ECS container metrics, and more.
- Process: Filter, batch, enrich, or transform the data before shipping it onward.
- Export: Send data to AWS services like CloudWatch, X-Ray, and Managed Prometheus, as well as third-party solutions like Datadog or SEQ.
Pipeline Example:
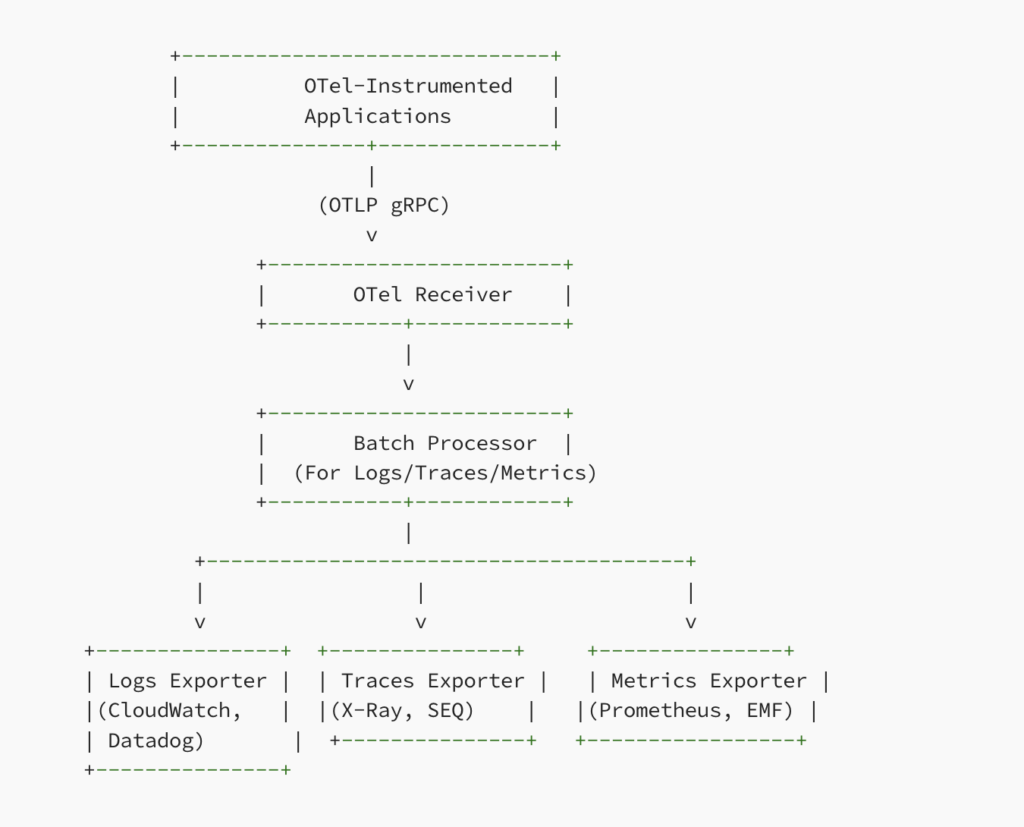
Imagine a pipeline where you’re receiving telemetry data from different microservices instrumented with OTel, applying transformations, adding metadata, batching the data to optimize performance, and then shipping it off to multiple destinations — X-Ray for traces, CloudWatch for logs, Prometheus Remote Write for metrics, and Datadog for aggregated observability dashboards. All of this is doable with a simple configuration file.
Receivers, Processors, and Exporters: The Building Blocks
Receivers: They’re the entry points into your pipeline. Examples include:
- prometheusreceiver: Scrape Prometheus endpoints.
- otlpreceiver: Receive OTel traces, metrics, and logs (often via gRPC for performance reasons).
- awsecscontainermetricsreceiver: Grab metrics from ECS containers.
- awsxrayreceiver: Ingest trace data from AWS X-Ray.
- statsdreceiver, zipkinreceiver, jaegerreceiver: Ingest data from various legacy or alternative observability formats.
- awscontainerinsightreceiver: For ECS/EKS container-level metrics.
Processors: They help you manipulate and optimize the data mid-stream.
- attributesprocessor: Modify attributes of the telemetry data.
- resourceprocessor: Enhance data with resource-level metadata (like cluster name, region, etc.).
- batchprocessor: Batch data to reduce overhead on downstream systems.
- filterprocessor: Drop noisy or unwanted data.
- metricstransformprocessor: Transform metrics (rename, aggregate) before exporting.
Exporters: Where the data ultimately lands.
- awsxrayexporter: Send traces to AWS X-Ray.
- awsemfexporter: Export metrics as EMF logs to CloudWatch.
- prometheusremotewriteexporter: Send metrics to a Prometheus Remote Write endpoint (like AMP).
- debugexporter: Debugging/logging locally.
- otlpexporter: Export telemetry to any OTel-compliant endpoint (like SEQ).
- datadogexporter: Send data to Datadog for visualization and analysis.
Example Configuration
Let’s say we have a pipeline that receives OTel data via gRPC (for better performance than HTTP), batches the data for efficient handling, and exports:
- Logs: To CloudWatch and Datadog
- Traces: To AWS X-Ray and also via an OTel HTTP exporter to SEQ
- Metrics: To AWS Managed Prometheus via the Prometheus Remote Write exporter (with Sigv4 auth) and to CloudWatch via the EMF exporter
OpenTelemetry Collector Config (config.yaml):
extensions:
  sigv4auth:
    region: "us-west-2"

receivers:
  # Receive OTel data over gRPC
  otlp:
    protocols:
      grpc:

processors:
  batch/logs:
    timeout: 5s
    send_batch_size: 1000
  batch/traces:
    timeout: 5s
    send_batch_size: 1000
  batch/metrics:
    timeout: 5s
    send_batch_size: 1000

exporters:
  # Logs
  awscloudwatch:
    region: "us-west-2"
    log_group_name: "my-app-logs"
    log_stream_name: "otel-collector"
  datadog:
    api:
      key: "${DD_API_KEY}"
    logs:
      service: "my-service"
      source: "otel"

  # Traces
  awsxray:
    region: "us-west-2"
  otlphttp:
    endpoint: "https://my-seq-server:4318/v1/traces"

  # Metrics
  prometheusremotewrite:
    endpoint: "https://aps-workspace-url:443/api/v1/remote_write"
    external_labels:
      cluster: "my-eks-cluster"
    auth:
      authenticator: sigv4auth
  awsemf:
    region: "us-west-2"

service:
  pipelines:
    logs:
      receivers: [otlp]
      processors: [batch/logs]
      exporters: [awscloudwatch, datadog]

    traces:
      receivers: [otlp]
      processors: [batch/traces]
      exporters: [awsxray, otlphttp]

    metrics:
      receivers: [otlp]
      processors: [batch/metrics]
      exporters: [prometheusremotewrite, awsemf]
A Visual Overview
Below is a rough diagram of the pipeline described above:

Deploying the Collector on AWS ECS
One of the coolest parts? You can run this entire collector as a sidecar or standalone service on AWS ECS. By doing this, you:
- Leverage IAM Roles: Let the ECS task use IAM roles to securely access AWS services like CloudWatch, X-Ray, and AMP — no need to manage separate credentials.
- Scale with Your Application: Spin up multiple collector instances as your services scale, ensuring you always have a robust observability backbone.
- Keep It Simple: Just define a task definition with the Collector container and you’re off to the races.
ECS Task Definition Example (JSON):
{
  "family": "otel-collector",
  "networkMode": "awsvpc",
  "executionRoleArn": "arn:aws:iam::123456789012:role/ecsExecutionRole",
  "taskRoleArn": "arn:aws:iam::123456789012:role/ecsTaskRoleWithAccess",
  "containerDefinitions": [
    {
      "name": "otel-collector",
      "image": "amazon/aws-otel-collector:latest",
      "cpu": 256,
      "memory": 512,
      "essential": true,
      "command": ["--config=/etc/ecs/otel-config.yaml"],
      "mountPoints": [
        {
          "sourceVolume": "config",
          "containerPath": "/etc/ecs"
        }
      ],
      "logConfiguration": {
        "logDriver": "awslogs",
        "options": {
          "awslogs-group": "/ecs/otel-collector",
          "awslogs-region": "us-west-2",
          "awslogs-stream-prefix": "ecs"
        }
      }
    }
  ],
  "volumes": [
    {
      "name": "config",
      "host": {
        "sourcePath": "/path/to/config"
      }
    }
  ],
  "requiresCompatibilities": ["FARGATE"],
  "cpu": "256",
  "memory": "512"
}
Using Environment Variables for Configuration
For even greater flexibility, you can store the entire OTel configuration as a base64-encoded string in an environment variable. This allows you to manage the config separately from the container image.
- Encode your
config.yamlto base64:
cat config.yaml | base64ECS Task Definition with Environment Variable Config:
{
  "family": "otel-collector-env-config",
  "networkMode": "awsvpc",
  "executionRoleArn": "arn:aws:iam::123456789012:role/ecsExecutionRole",
  "taskRoleArn": "arn:aws:iam::123456789012:role/ecsTaskRoleWithAccess",
  "containerDefinitions": [
    {
      "name": "otel-collector",
      "image": "amazon/aws-otel-collector:latest",
      "cpu": 256,
      "memory": 512,
      "essential": true,
      "environment": [
        {
          "name": "OTEL_CONFIG_BASE64",
          "value": "BASE64_ENCODED_CONFIG_HERE"
        }
      ],
      "command": [
        "sh",
        "-c",
        "echo \"$OTEL_CONFIG_BASE64\" | base64 -d > /etc/ecs/otel-config.yaml && /otelcol --config=/etc/ecs/otel-config.yaml"
      ],
      "logConfiguration": {
        "logDriver": "awslogs",
        "options": {
          "awslogs-group": "/ecs/otel-collector-env-config",
          "awslogs-region": "us-west-2",
          "awslogs-stream-prefix": "ecs"
        }
      }
    }
  ],
  "requiresCompatibilities": ["FARGATE"],
  "cpu": "256",
  "memory": "512"
}
Why This Approach?
- Flexibility: Update configurations without rebuilding your container image.
- Security & Versioning: Store configuration securely in SSM Parameter Store or Secrets Manager, referencing them as environment variables.
- Portability: Switch environments or backends by simply changing the environment variable value.
Integrating Terraform for Automated Task Definitions
Terraform simplifies managing AWS infrastructure, including ECS task definitions. You can store your config.yaml in a Terraform template file. This approach lets you version your OTel configuration in your Infrastructure as Code (IaC) repository.
The sample below does not encode the configuration in Base64, but you can easily choose to do so if you prefer (previous example with base64 decode to a local file in container commands).
Example Terraform Setup:
- Create a template file
otel_config.yaml.tplcontaining your desired OTel configuration:
receivers:
  otlp:
    protocols:
      grpc:
# ... rest of the config ...
2. In your Terraform code, render the template in a env variable:
data "template_file" "otel_config" {
  template = file("${path.module}/otel_config.yaml.tpl")
  # You can pass variables to your template if needed
  vars = {
    region = "us-west-2"
  }
}

resource "aws_ecs_task_definition" "otel_collector" {
  family                   = "otel-collector-env-config"
  requires_compatibilities = ["FARGATE"]
  network_mode             = "awsvpc"
  cpu                      = 256
  memory                   = 512
  execution_role_arn       = "arn:aws:iam::123456789012:role/ecsExecutionRole"
  task_role_arn            = "arn:aws:iam::123456789012:role/ecsTaskRoleWithAccess"

  container_definitions = jsonencode([
    {
      name      = "otel-collector"
      image     = "amazon/aws-otel-collector:latest"
      essential = true
      cpu       = 256
      memory    = 512
      environment = [
        {
          name  = "AWS_OTEL_COLLECTOR_CONFIG"
          value = data.template_file.otel_config.rendered
        }
      ]
      command = [
        "--config",
        "env:AWS_OTEL_COLLECTOR_CONFIG"
      ]
      logConfiguration = {
        logDriver = "awslogs"
        options = {
          "awslogs-group"         = "/ecs/otel-collector-env-config"
          "awslogs-region"        = "us-west-2"
          "awslogs-stream-prefix" = "ecs"
        }
      }
    }
  ])
}
What’s Happening Here?
- We use a
template_filedata source to load and render theotel_config.yaml.tpl. - We pass the encoded config as an environment variable
AWS_OTEL_COLLECTOR_CONFIGto the ECS task. - At runtime, the container get the config from the env variable with the config parameter and runs the collector.
Advantages of Terraform Integration:
- Version-Controlled Config: Store your OTel config in Git, along with your Terraform code.
- Consistent Deployments: Terraform’s declarative approach ensures that changes are safely reviewed, versioned, and rolled out.
- Parameterization: Pass variables into the OTel config template, adjusting exporters, receivers, or processors based on environment or stage.
Performance Considerations:
- Resource Allocation: Start with modest CPU and memory and scale as needed.
- Batching & Processing: Adjust batch sizes and timeouts for optimal throughput.
- Scaling Out: Run multiple Collector instances behind a load balancer if you have high data volumes (aws alb)
Wrap-Up
The AWS OpenTelemetry Collector is a powerful tool for taking control of your observability pipeline. By standardizing on OTel for logs, metrics, and traces, you gain the freedom to choose backends that best fit each dimension of your observability stack — without vendor lock-in. With a single configuration, you can shape, transform, and route telemetry data across AWS and third-party services, and deploying it on ECS makes it even simpler to manage, scale, and secure.
Whether you embed the configuration directly into the container or load it dynamically from environment variables, the AWS OTel Collector provides a flexible, vendor-neutral, and future-proof platform to manage all your observability data. That’s the power of Observability 2.0 — freedom, clarity, and adaptability.